Date: August and September 2021
I programmed this with Cintong He, a fellow student at The Early College at Guilford.
We made it for our final project for Scientific Computing. It uses
Python Turtle Graphics to simulate COVID as well as show how effective vaccines and
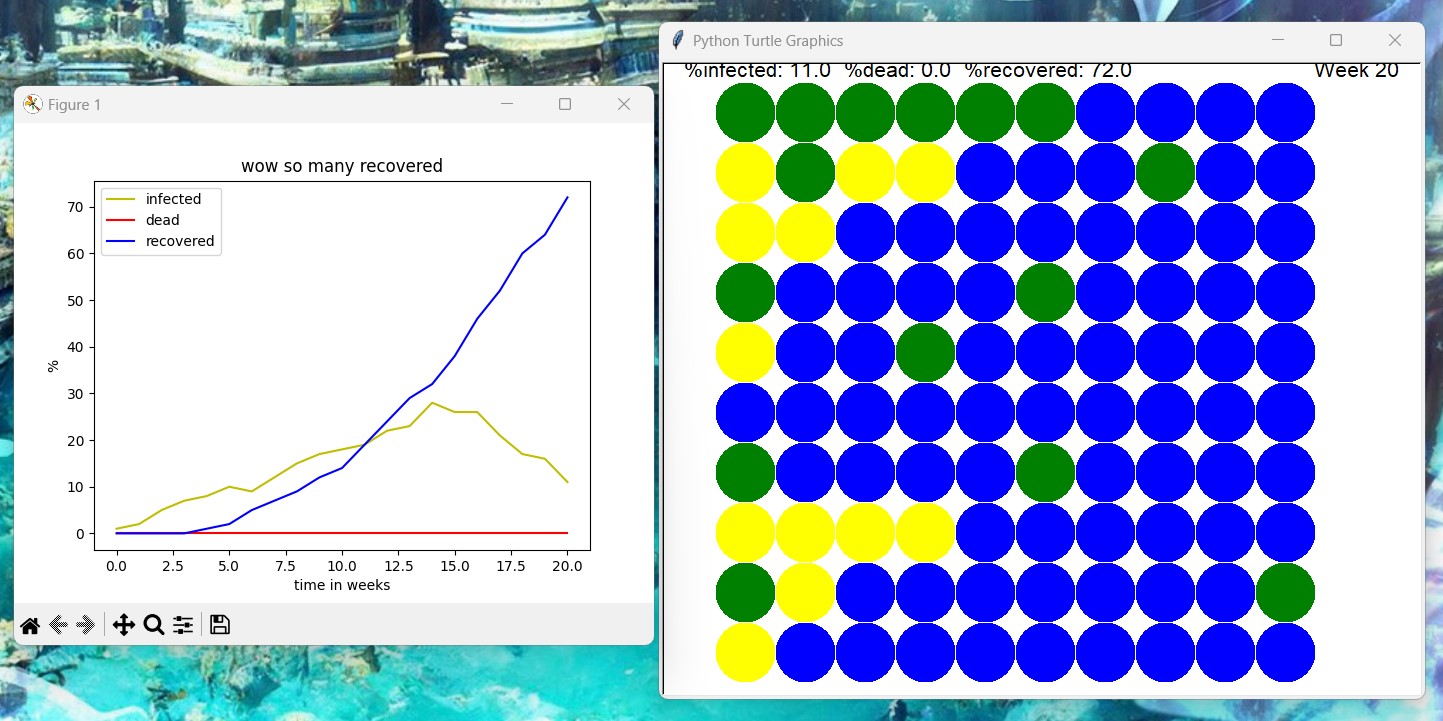
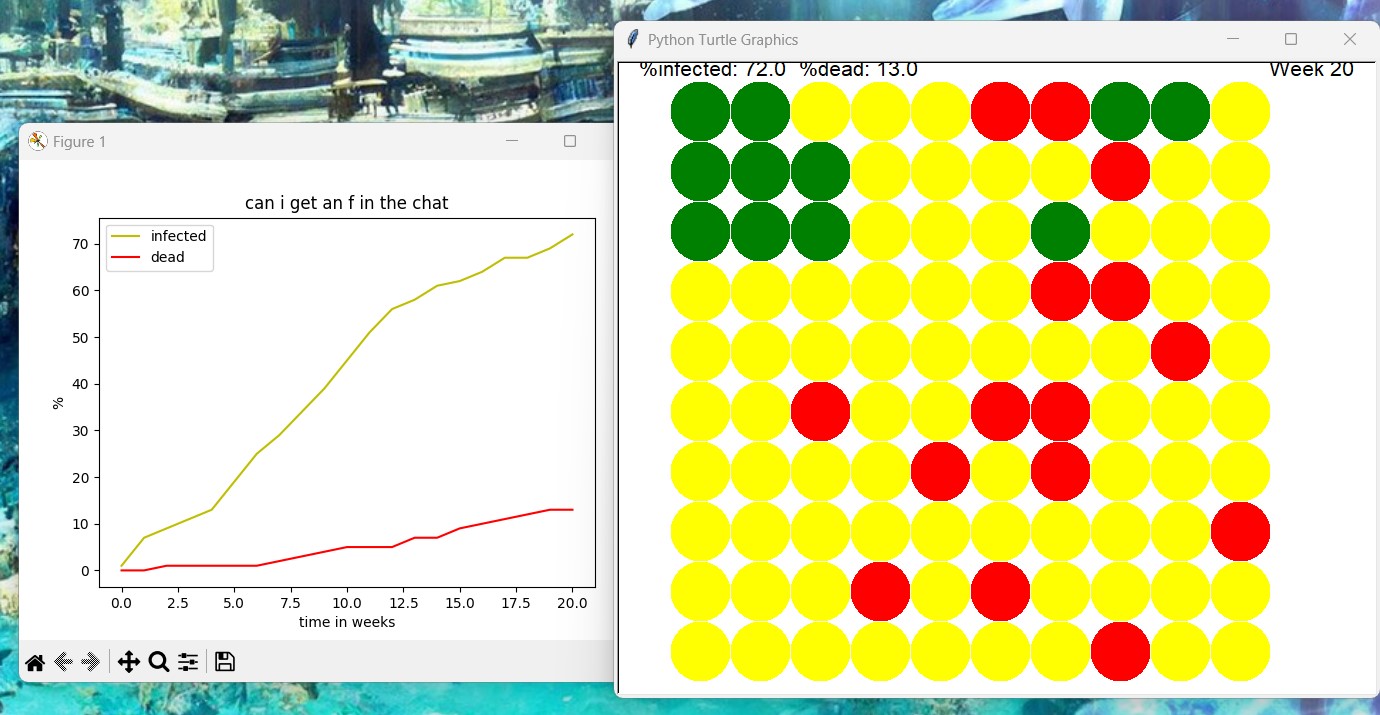
quarantining could be. We also added two modes, flu and "Plague, Inc." Flu is where
people are immune upon recovery, and plague is where people cannot recover. It uses
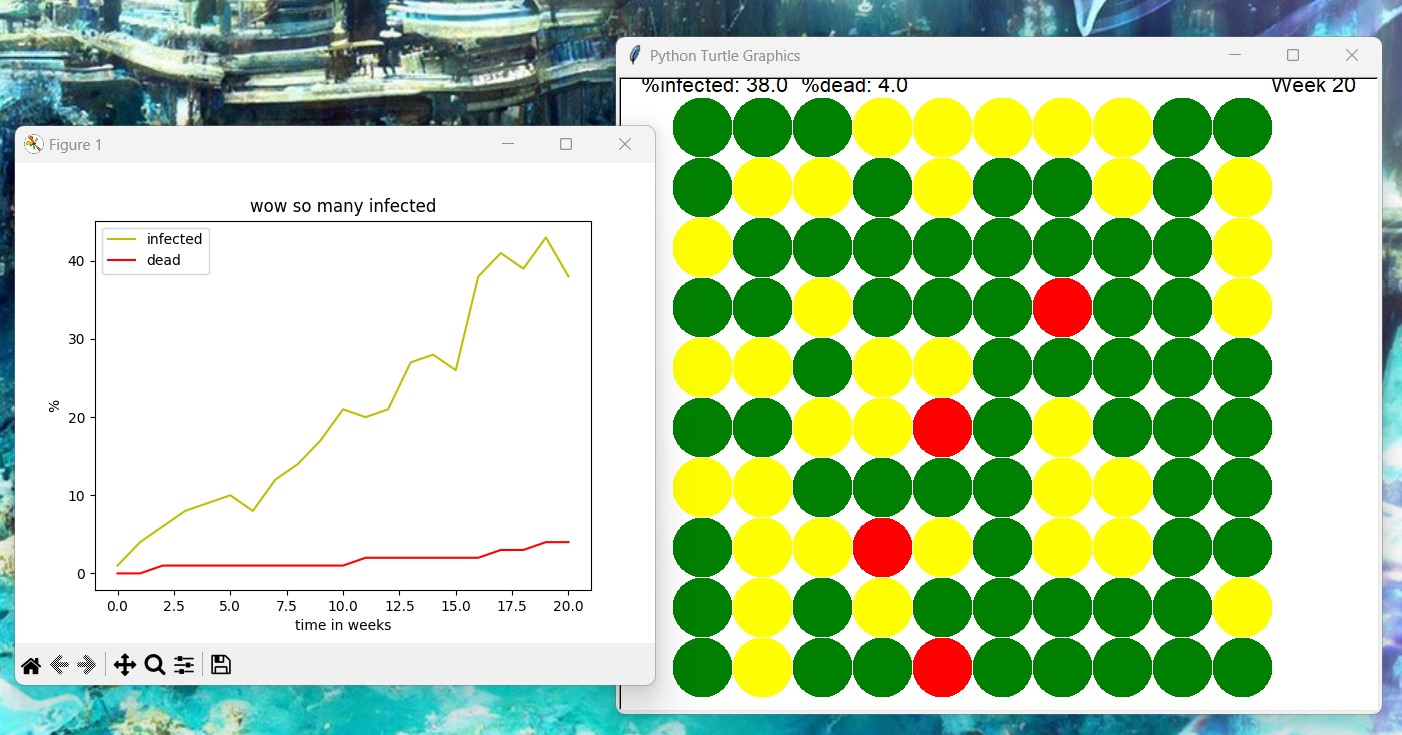
probability to simulate a circle's condition. Green is healthy, yellow is infected, red is dead,
and blue is immune (only present in flu mode). We also implemented a distance factor, which extends
the probabilities for however far the circles are away. The graph at the end uses
matplotlib to show the circles' conditions over time.